A Spatial Biology Startup Guide – Part 1
The top 20 questions for ensuring preanalytical quality control
Michael Surace, Houssein A. Sater, Carlos Andrea, Jeffrey Chun Tatt Lim, Carmen Ballesteros-Merino, Jaime Rodriguez Canales, Joe Yeong | | Longer Read
Multiplexed immunofluorescence/immunohistochemistry (mIF/IHC) is a comparatively new tool for investigating the spatial tumor microenvironment. It has high potential in both clinical and translational applications, with its nearest-term applications in cancer immunotherapies – particularly in uncovering biomarkers for more accurately predicting patient response to immunotherapies and in situations involving a limited supply of tissue specimens.
A 2019 systemic review and meta-analysis of studies showed that mIF/IHC improved prediction of responses to PD-1 /PDL-1 checkpoint blockade immunotherapy in 10 solid tumor types when compared with conventional monoplex IHC analysis (1). Another study, published in early 2021, also demonstrated that mIF/IHC techniques can offer multi-site reproducibility (2).
Here, we discuss which considerations should be prioritized when setting up the preanalytical components of mIF/IHC in a histology laboratory.
1. What is the pathologist’s role in developing the mIF panel?
The pathologist should be involved in every step during the development of an mIF/IHC panel, from panel design to final quality control (QC). They can provide valuable scientific and clinical guidance on issues including biomarker selection, validation, processing, QC, and evaluation of tissue specimens. The pathologist is also instrumental in interpreting the data. Ultimately, the productivity of any mIF/IHC study depends on successful collaboration between the pathologist, the project scientist, and the immunologist if needed.
2. When should I go through the effort and expense of developing an mIF/IHC panel?
Although the best tool for the job is not always apparent, the principal determinant should always be the scientific question at hand, followed by sample availability.
Because mIF/IHC panel design and validation is more demanding than conventional monoplex IHC, it should be used only when several conventional monoplex IHC assays cannot answer the critical questions. For example, if the required data is limited to the abundance of several markers at the whole-slide or regional level, and several slides are available for each case, then conventional monoplex IHC will suit. If, however, the required data includes colocalization of multiple markers within the same cell, proximity distance measurements between single cells of different phenotypes, and their relative spatial distribution, mIF/IHC is more informative. Finally, if samples are precious or difficult to acquire, this may justify the development of mIF/IHC solutions. That decision is subjective, however, and highly dependent on the laboratory and the project.
3. Labs have validated many conventional monoplex IHC protocols for routine diagnostic work. How can we leverage the hard work we’ve already put into these protocols to yield a validated mIF/IHC panel?
There are several ways to leverage conventional monoplex IHCs to inform multiplex panel development. The simplest approach is to develop an iterative conventional monoplex IHC staining strategy, using AEC as the chromogen, with sequential rounds of antibody staining, whole-slide scanning, and antibody stripping/removal, followed by fusion and alignment of multiple brightfield images for analysis.
But this approach is time-consuming (and currently manual). A better alternative is to select a mIF/IHC staining system in which the primary antibodies are unlabeled. This allows identical primary antibody binding conditions (blocking, concentration, diluent, temperature, and time) to be recapitulated in the multiplex. If primary antibodies are directly labeled with an oligo, hapten, or metal tag, binding conditions should be redeveloped or at least confirmed.
Once sensitivity and specificity are established, primary antibody binding conditions should remain unchanged. Other important considerations include testing the staining order, fluorophore selection, and concentration; validation against conventional monoplex IHC; and reproducibility testing. Despite the additional steps, this is the best way to leverage conventional monoplex IHC assays into a mIF/IHC panel.
4. What can we do to ease pathologists’ discomfort with fluorescent images and facilitate their interest in these novel technologies?
Pathologists experience discomfort in part due to lack of time and inexperience with immunofluorescence. Unfortunately, the complexity of mIF/IHC adds to the time demand in two ways. First, multilayered biomarker data requires toggling back and forth between multiple channels (unlike traditional pattern recognition based on light microscopy). Second, digitization also is a matter of experience – and a challenge for pathologists who are more comfortable with manual slide review. Although chromogenic stains are easier for most users to classify into positivity bins (1–3+), immunofluorescence has a larger linear dynamic range, with which pathologists often have less experience in general. Fortunately, with appropriate training, a data-backed standard threshold method, and education on the benefits of this new technology, pathologists can become more comfortable with mIF/IHC.
Additionally, many digital pathology analysis programs now offer the option of pseudo-coloring, which can ease new users in by showing each marker (or any combination, such as green+red signals = yellow signal) individually, just as they would have appeared in standard digital pathology (or even traditional microscopy) images.
5. What if pathologists or histologists are uncomfortable with quantification using software?
Visualization of the whole slide images (WSI), in contrast to a region-of-interest (ROI) demonstration, is one potential way to make pathologists comfortable with software scoring, especially if one can generate a pseudo-IHC WSI (see Figure 1). Most pathologists and histologists should be able to manually score the mIF/IHC WSI by showing each marker or combination individually, as with standard digital pathology solutions.
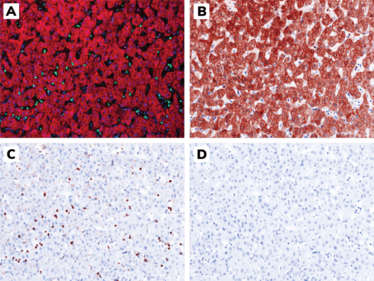
Figure 1. Representative images of normal liver tissue adjacent to stained using mIF/IHC and the simulation of its “pseudo-IHC.” A. mIF/IHC: DAPI (blue), CD3 (green), pan-cytokeratin (red); B. pseudo-IHC: DAPI (blue), pan-cytokeratin (brown); C. pseudo-IHC: DAPI (blue), CD3 (brown); D. pseudo-IHC: DAPI (blue). Magnification: 200X. Credit: Jeffrey Chun Tatt Lim, Institute of Molecular Cell Biology, A*STAR, Singapore.
6. Do we need a darkroom for mIF/IHC?
Multiplex immunofluorescence protocols that combine straightforward reagents and tissue imaging processes can be conducted in a standard wet laboratory. Access to a darkroom is optional.
7. Are there special considerations around tissue thickness for mIF/IHC?
Proper tissue thickness is the key to high-quality mIF/IHC images. Routine FFPE tissue is cut at 4–5 μm, typically one cell thick, which is suitable for mIF/IHC analysis.
Some tissue types have different section thickness considerations. Brain and central nervous system (CNS) tissue, for example, require 8–10 μm sections to show neurons. In situations where tissue sample is limited, on the other hand, such as with core biopsies or lymph node studies, 3 μm is acceptable – but thicknesses lower than 2 μm are at risk of causing inaccurate results.
8. Can I use my existing conventional monoplex IHC pipeline for tissue processing, sectioning, and staining?
Tissue processing and sectioning should be undertaken under the same conditions. Remember that the optimization and validation of an mIF/IHC panel are done in the following order: i) conventional monoplex IHC; ii) monoplex IF; and iii) the mIF assay. These stains are performed in consecutive tissue slides.
Staining protocols for converting conventional monoplex IHC to mIF can vary. This was highlighted in the MITRE study, where researchers had to change the secondary detection system to achieve the same signal intensity between the two assays (2).
9. What controls should be processed with each staining run?
Three principal controls should be performed with each staining run. The first is the positive control, which should represent the previously characterized tissue of interest. This helps determine whether all reagents were distributed properly by the automated stainer and can serve as a normalization control if post-imaging normalization is required to mitigate batch effects. It may be appropriate to run several positive controls if subdividing the batches.
The second is the isotype, or specificity, control. All primary antibodies should be replaced with nonspecific antibodies to reveal the degree to which non-primary reagents in the staining protocol contribute to the observed signal in each channel.
The third is the autofluorescence control. All fluorophores should be omitted for this control. This will reveal the combined autofluorescence in the tissue, along with the fluorescence of all reagents that are not designed to contribute directly to the fluorescence signal in each channel.
10. Can frozen samples be used for mIF/IHC?
mIF/IHC is not often performed on frozen samples, because tissue architecture is not as well preserved in fresh frozen tissue as in FFPE samples. Exceptions are for mouse studies in the brain and CNS, which are mainly performed in frozen tissues cut 8–10 μm thick.
One option is to use frozen converted FFPE at the typical 4–5 μm thickness (especially for clinical trial samples), with conversion occurring at either the tissue block or slide level.
11. Are there special considerations for challenging sample types?
Tissues such as bone and CNS tend to show high background staining, which can cause challenges for some markers when distinguishing between specific and nonspecific staining signals. The potential for this problem can be reduced by working with thinner sections, optimizing the blocking steps, and using monoclonal primary antibodies. Using select antibody diluents and blocking reagents can significantly reduce background further and enhance staining intensity.
In addition, CNS tissue can present autofluorescence challenges due to high levels of lipofuscin. Incubating the slides in Sudan black or lipofuscin quencher solutions helps alleviate this problem. The same solutions can be applied for IF background staining in bone marrow. This issue can be further tackled with technology that utilizes multispectral imaging and spectral unmixing, allowing for isolation of autofluorescence to a discreet channel and of each biomarker of interest, regardless of intensity or spectral overlap providing data accuracy and quantitative information.
12. What are best practices for storing cut slides and tissue blocks?
Although tissues can be preserved in different ways, FFPE is the main method used to store clinical samples across hospitals and research centers. Research has led to some debate in the efforts to understand the chemistry of formalin fixation and the degradation of biomolecules in FFPE tissues.
Nevertheless, consensus is to keep the tissue in the paraffin block (ideally with the cut surface covered by a paraffin layer to avoid tissue oxidation) at room temperature in a dry environment and protected from light. Well-preserved blocks can be stored successfully for up to 10 years. After that, noticeable tissue degradation can occur, so both morphological quality (H&E) and antigenicity on tissue blocks older than 10 years should be confirmed before the start of any study.
Although slide storage protocols are also debatable, the main consensus is to use fresh-cut slides, without removing the paraffin from the tissue section, stored at 4°C) inside a slide box. Some recommend storing cut slides in a dry chamber with nitrogen (to avoid tissue oxidation), but not all labs are equipped with nitrogen chambers. After three months, epitope decay in some markers can occur; therefore, best practices for mIF/IHC studies would be to use slides that are less than three months old.
13. Is it feasible and useful to cocktail two markers in a single channel?
In general, two markers in a single channel can be mixed safely. The preference, however, is to separate markers unless they are part of diagnostic cocktails that can be interpreted by the pathologist. In mIF/IHC specifically, one common way of mixing two markers in one channel is to mix multiple tumor/cancer markers into one channel – for instance, pan-cytokeratin and any other cytokeratin (such as CK18 in a liver sample), or SOX10 and EPCAM to highlight tumor and epithelium.
14. What is a reasonable panel size?
The number of markers in a panel depends on the features of the technical platform and the goals of the study. More is not necessarily better when it comes to translational and clinical research. For a specific project, a three-marker panel could be more than sufficient – for instance, scoring PD-L1 by co-staining with pan-cytokeratin or CD45 (3). For a wide exploratory study in which multiple markers are needed to discover an expression profile, consider a platform with large-scale capabilities. Nevertheless, for any panel or method used, validation (of both methodology and data) is crucial to success.
15. How do I select a palette of fluorophores? What are some strategies for matching markers, staining chemistry, and imaging platforms?
The properties of the target biomarker, the antibodies used to detect it, and the fluorophore itself will determine decisions in this step of the process (4). The target biomarker’s pattern of expression (nuclear, cytoplasmic, or membranous), abundance of expression (few to hundreds of cells), and level of expression within each cell are important factors, along with possible true or aberrant expression of the biomarker in non-target cells.
The detection system, primary and secondary antibodies, and fluorescent molecule of choice are vital in determining the final result’s specificity (signal-to-noise ratio). Because fluorophores have various naturally occurring intensities determined by their emission wavelength, the rule of thumb is to try to match a weak fluorophore with an abundant or intense biomarker.
Other determinants of the platform outcome will depend on prior optimization processes to find the right antibodies and fluorophore concentrations.
16. How does one detect and mitigate batch effects when staining a large number of samples?
Batch effects are always a risk, even after perfection of the optimization and QC processes. As an important step in the QA process, an experienced IHC technician, scientist, or pathologist should review slides/images for aberrancies, including batch effects, prior to proceeding with analysis. Depending on the question at hand and the type of aberrant, the batch effect may be salvageable. Trained pathologists can easily spot and manage batch effects. Following the exact same steps when optimizing and standardizing preanalytical variables for each slide generally reduces their frequency to less than 10 percent.
17. How does one detect and mitigate batch effects when imaging those samples?
Batch effects in primary images (those generated directly by the scanner after setup optimization) are driven by changes in settings or by the mechanical properties of the scanner, such as light source, stage and reference calibration, slide/coverslip thickness, and other variables. Detecting these nuances and batch effects typically requires the input of an experienced lab scientist or pathologist. Their oversight of the QA/QC process is critical to address batch effects at this stage, because primary images determine the next batch of images to be generated.
Secondary images are typically generated based on a reference library and an unmixed algorithm. Such methods can be subject to batch errors due to slide-to-slide variability or staining aberrancies – so proper staining is key. Algorithms may also be skewed by the variation in staining based on abundance and distribution of various fluorophores, making them a potential source of batch errors. After all, the algorithm also depends on the image input and reference library, whether synthetic or measured.
Similarly, batch effect problems may arise during image analysis after an algorithm has been trained to perform image segmentation and scoring. This relates to all the points mentioned above, plus the capacity of artificial intelligence (AI) to accurately predict further segmentation and scoring. Therefore, batch effects must undergo QA/QC by a trained team of scientist and pathologists to determine their impact and avert errors in data reporting that may harm the precision of such a powerful technology.
18. Can I build an mIF/IHC panel from an existing, validated flow cytometry panel?
Possibly; however, most flow cytometry antibodies are not compatible with IHC, especially IHC-paraffin. This is most likely because the epitope presentation of an antigen in cell suspension could differ from IHC tissue sections.
Fluorochromes are usually conjugated directly to primary antibodies in flow cytometry. Conversely, most IHC and mIF/IHC protocols use indirect labeling methods requiring secondary antibodies for signal amplification. A good signal-to-noise ratio for detection by flow antibodies can be challenging for mIF/IHC, because signals may appear weak or undetectable for less abundant or weakly expressed proteins.
Flow and IHC scientists may also have different perspectives on cell phenotype detection. IHC scientists might use only FOXP3 antibody for identification of regulatory T cells, for example, whereas flow scientists usually include lineage markers. Literature reviews and discussions with immunologists and pathologists are recommended before translating flow panels to mIF/IHC.
19. Do I need a particular device to achieve multiplexing or is my fluorescent scanning-compatible digital pathology scanner sufficient?
This depends on the number of markers targeted for detection. With a compatible detector setup, most conventional imagers/scanners equipped in histopathology laboratories can easily achieve four-color mIF/IHC. Some non-multiplex-specific scanners can be tweaked to detect up to six markers. For visualization beyond seven colors, a multispectral multiplex imager/scanner is recommended, but not a “must-have.”
20. What are some of the considerations around performing WSI efficiently?
Tissue microarrays (TMA) are the most cost-effective way to perform mIF/IHC. However, even if the TMA was constructed by the pathologist, the morphology and the composition of the TMA tissues will be changed after a few sections. H&E staining is recommended before starting a project to ensure that the TMA is still suitable.
In a relatively resource-unlimited setting, WSI – and even whole-slide analysis – would be the ideal way to mimic the pathological examination. However, one must be careful to differentiate between “whole-slide analysis” and “whole-slide examination.” Pathologists do need to examine the whole slide, but do not need to quantitate the whole slide. Even when the focus is on the tumor region, some biomarkers are only scored in the hotspots. Putting the right answer – and the right scientific question – into the right context is the key to successful outcomes.
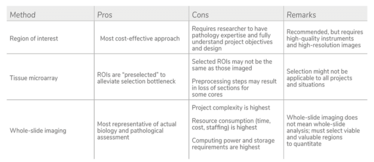
INFOGRAPHIC: mIF/IHC Imaging Approaches
With thanks to JEDI – the Council for Multiplex IHC/IF Global Standardization.
- S Lu et al., “Comparison of biomarker modalities for predicting response to PD-1/PD-L1 checkpoint blockade: a systematic review and meta-analysis,” JAMA Oncol, 5, 1195 (2019). PMID: 31318407.
- JM Taube et al., “Multi-institutional TSA-amplified Multiplexed Immunofluorescence Reproducibility Evaluation (MITRE) study,” J Immunother Cancer, 9, e002197 (2021). PMID: 34266881.
- J Yeong et al., “Multiplex immunohistochemistry/immunofluorescence (mIHC/IF) for PD-L1 testing in triple-negative breast cancer: a translational assay compared with conventional IHC,” J Clin Pathol, 73, 557 (2020). PMID: 31969377.
- ER Parra, “Validation of multiplex immunofluorescence panels using multispectral microscopy for immune-profiling of formalin-fixed and paraffin-embedded human tumor tissues,” Sci Rep, 7, 13380 (2017). PMID: 29042640.
Associate Director of Translational Medicine Oncology at AstraZeneca, Gaithersburg, Maryland, USA.
Houssein A. Sater is an immuno-oncologist and physician-scientist in hematology-oncology at the Cleveland Clinic’s Carol and Robert Weissman Cancer Center, Stuart, Florida, USA.
Pathologist at the University of Navarra, Pamplona, Spain.
Senior Research Officer at the Institute of Molecular and Cell Biology, A*STAR, Singapore.
Carmen Ballesteros-Merino is a Research Scientist at Earle A. Chiles Research Institute, Providence Cancer Center, Portland, Oregon, USA.
Senior Pathologist at AstraZeneca, Gaithersburg, Maryland, USA.
Group Leader at the Institute of Molecular and Cell Biology, A*STAR, Singapore.
